Item 19: Where Franchise Promises Meet Reality

The Risk is Bigger Than it Looks
Franchising is often positions as the “safer” path to business ownership.
But the data tells a different story:
Many units underperform the averages shown in Item 19
Profitability is rarely discussed
Operational realities (capacity, staffing, local demand) are not reflected in headline numbers
You’re being asked to invest hundreds of thousands of dollars based on incomplete information.
What you’re shown may not be what you’ll earn
Franchise sales are built on a simple narrative:
“Here’s what our locations make.”
But what most buyers don’t realize is this:
Item 19 is not a guarantee. It’s a selective presentation of performance.
Averages can hide week locations
Top performers can skew the story
Critical costs, variability, and operational constraints are often left out
And once you sign, those numbers become your problem, not theirs.
What this Page Does
This is not a sales pitch for franchising.
This is where we break down:
What Item 19 actually shows, and what it doesn’t
How averages are constructed (and how they mislead)
The gap between reported revenue and real-world profitability
The specific questions you should be asking before you sign
Independent Analysis. No Commissions. No Agenda.
Franchise brokers and consultants get paid when you buy.
We don’t.
Our role is simple:
Pressure test the numbers before you commit.
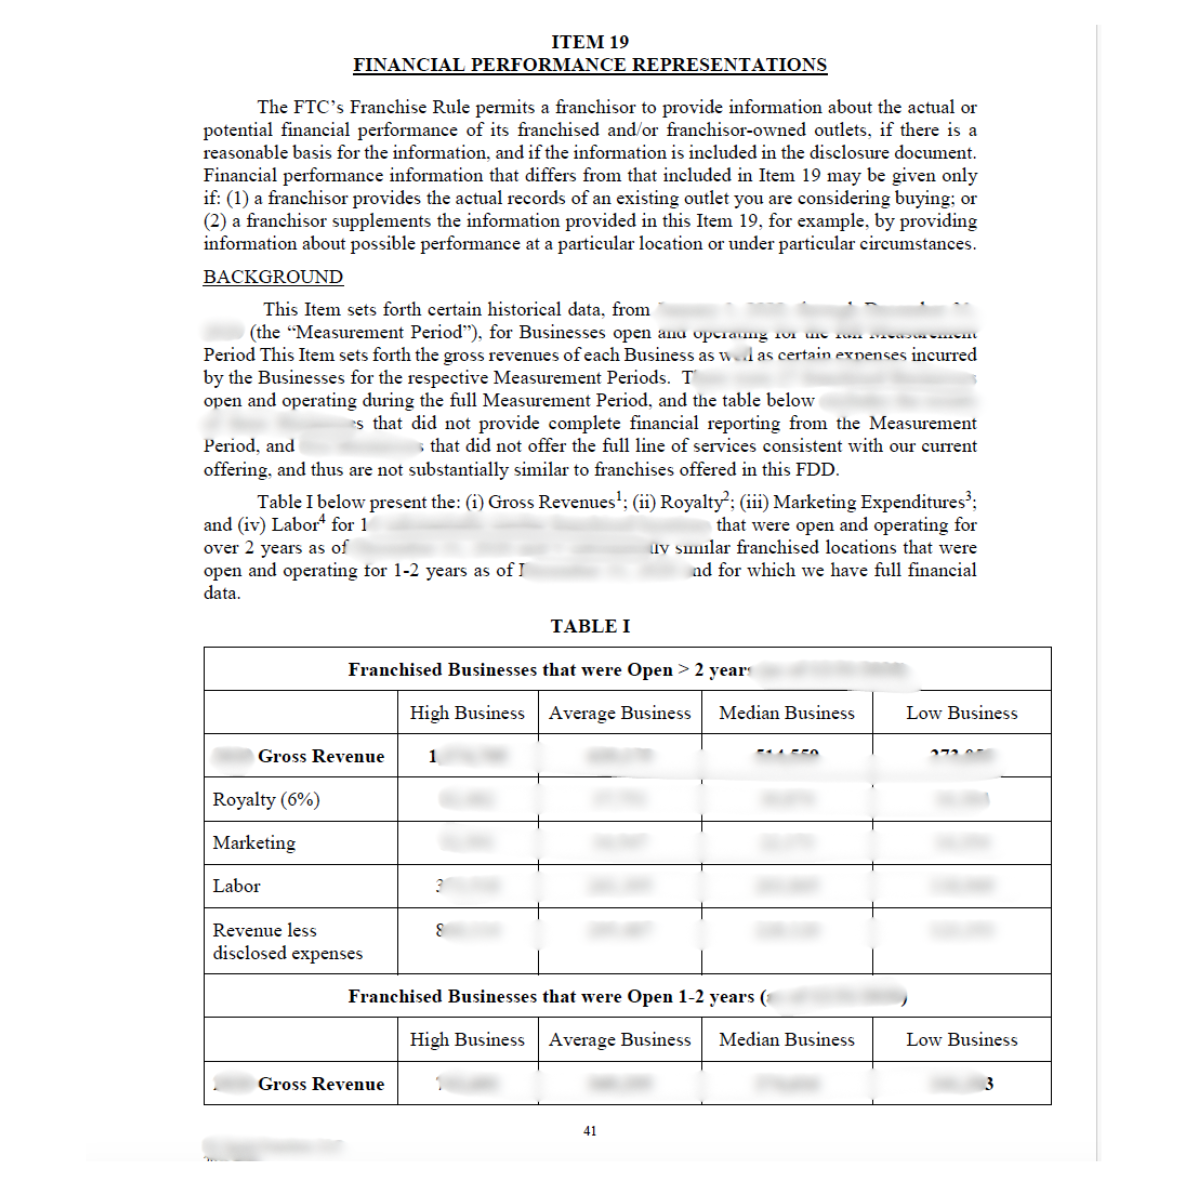
3 Ways Item 19 Can Mislead You
1. Averages Hide More Than They Reveal
Most Item 19 disclosures highlight average or median revenue.
What they don’t show clearly:
How many locations are below that number
How wide the performance range really is
Whether the “average” is driven by a small number of top performers
Two buyers can invest in the same franchise and have completely different outcomes.
2. Revenue Is Not Profit
Item 19 almost always focuses on top-line revenue.
But revenue doesn’t tell you:
What it costs to operate
Whether the model supports sustainable margins
How sensitive performance is to labor, utilization, or local demand
You don’t invest in revenue. You invest in cash flow.
3. The Model Behind the Numbers Isn’t Explained
Even when the numbers are accurate, the assumptions behind them are often missing:
How many customers are required to hit those numbers?
How many transactions per day?
What level of utilization is assumed?
Is that realistic given the physical setup and operating hours?
The math can look right—and still not work in reality.
Want to See How This Plays Out in the Real World?
We broke this down step-by-step using a real Item 19 example—showing how headline numbers can look compelling, but fall apart when you analyze the underlying economics.
👉 Read the full breakdown: [ROI Math: What Item 19 Really Tells You]
What This Means for You
Item 19 is not useless.
But it is incomplete.
And if you rely on it without deeper analysis, you’re making a six-figure decision based on a partial picture.
What We Do Differently
We go beyond the headline numbers and answer the questions that actually matter:
Can this model realistically produce the revenue being shown?
What does that translate to in actual earnings?
What has to go right operationally for you to succeed?
Where are the risks that aren’t obvious in the FDD?
This is the difference between reviewing a document… and understanding the investment.
Schedule a Consultation
If you're evaluating a franchise and want an objective perspective before making a commitment:
👉 Schedule a consultation
Or reach out directly:
billbeckham@franchiseclarity.net